Our most recent release in the Buildkite Agent (version 3.27.0) includes a community member-submitted integration with Datadog APM. We’ve been looking forward to sharing this feature because it provides a lot of insight into your CI/CD process.
For example, it can surface details like how efficiently are we spending our compute? Is there a better way for us to optimize our slowest steps? And what are the common errors that we are encountering on the steps that fail more often?
PR review process
This feature was originally submitted by GitHub users goodspark and samschlegel who submitted a PR to our open-source Buildkite agent repository.
One of our initial barriers to reviewing this PR was that while we already used Datadog for logs and monitoring, we didn’t use APM until later in 2020. Once we had our own Datadog APM setup, we were able to simply connect the Buildkite agent and confirm the trace information it surfaces was correct and useful.
Testing process
We created a new Edge (preview) release and ran it on our agents for two weeks by customizing the agent bootstrap script on our own Elastic CI Stack for AWS fleets. We test all of our agent features this way, to confirm that changes we make are stable enough to run on our own CI infrastructure (plus that of other users who also explore new features on the Edge release channel).
No news is good news in this situation – the tracing was nice and stable, and we were able to confirm that Buildkite agent trace data was propagating into our Datadog account. We promoted the feature and released a new stable version shortly after.
Tour of Buildkite APM tracing in Datadog
Services
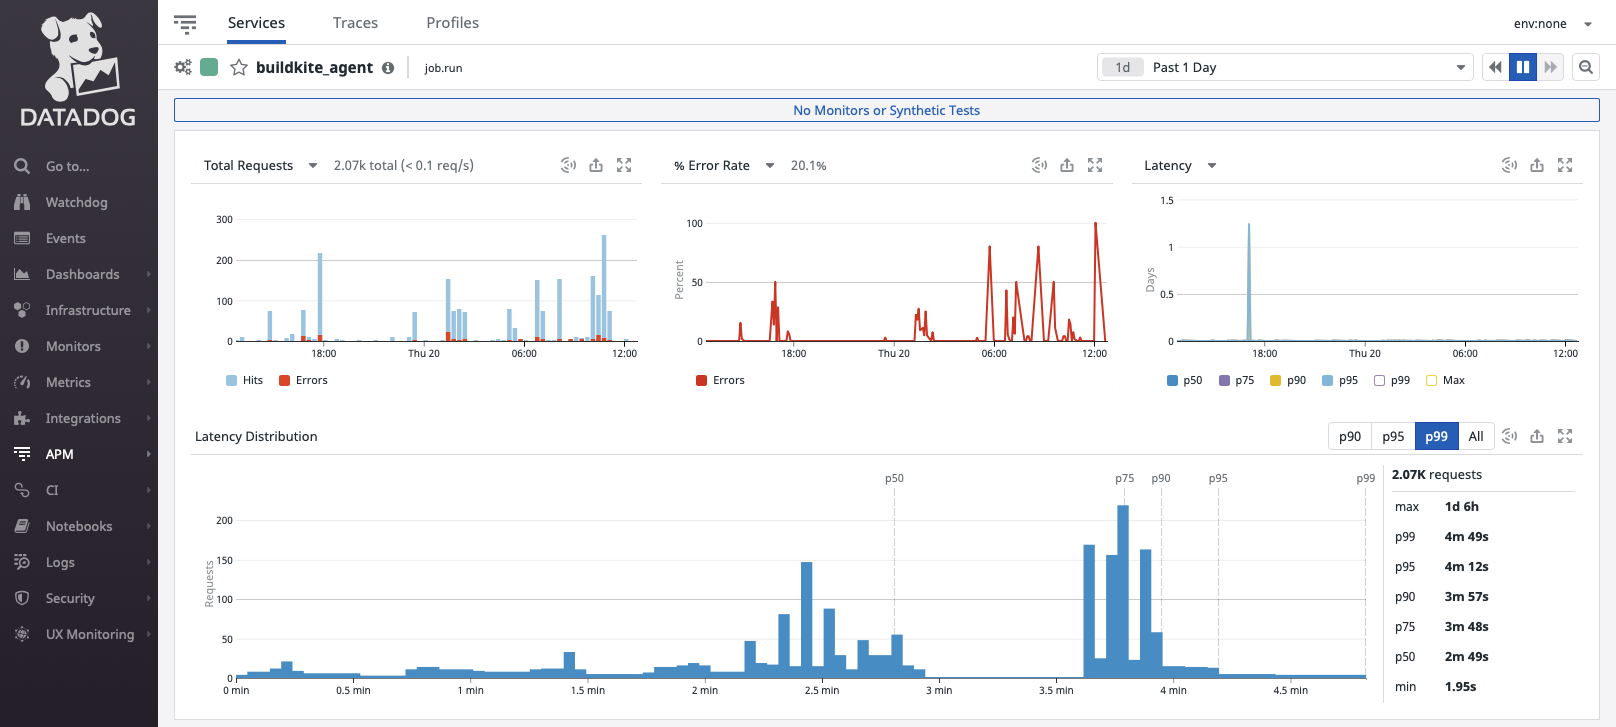
Datadog APM has a landing page similar to this for each service you are monitoring, it’s typically geared towards production services, but it translates well to CI infrastructure monitoring.
For now, the OpenTracing configuration will use “buildkite_agent” as the default service name, but we’ll explore making this customizable in the future. The top three graphs show Requests, Errors, and Latency over a configurable time period. On busy CI infrastructure this data can be used to track usage about when your busiest (or quietest) times of day are, and if there are unusually more errors or step latency at particular times.
Resources
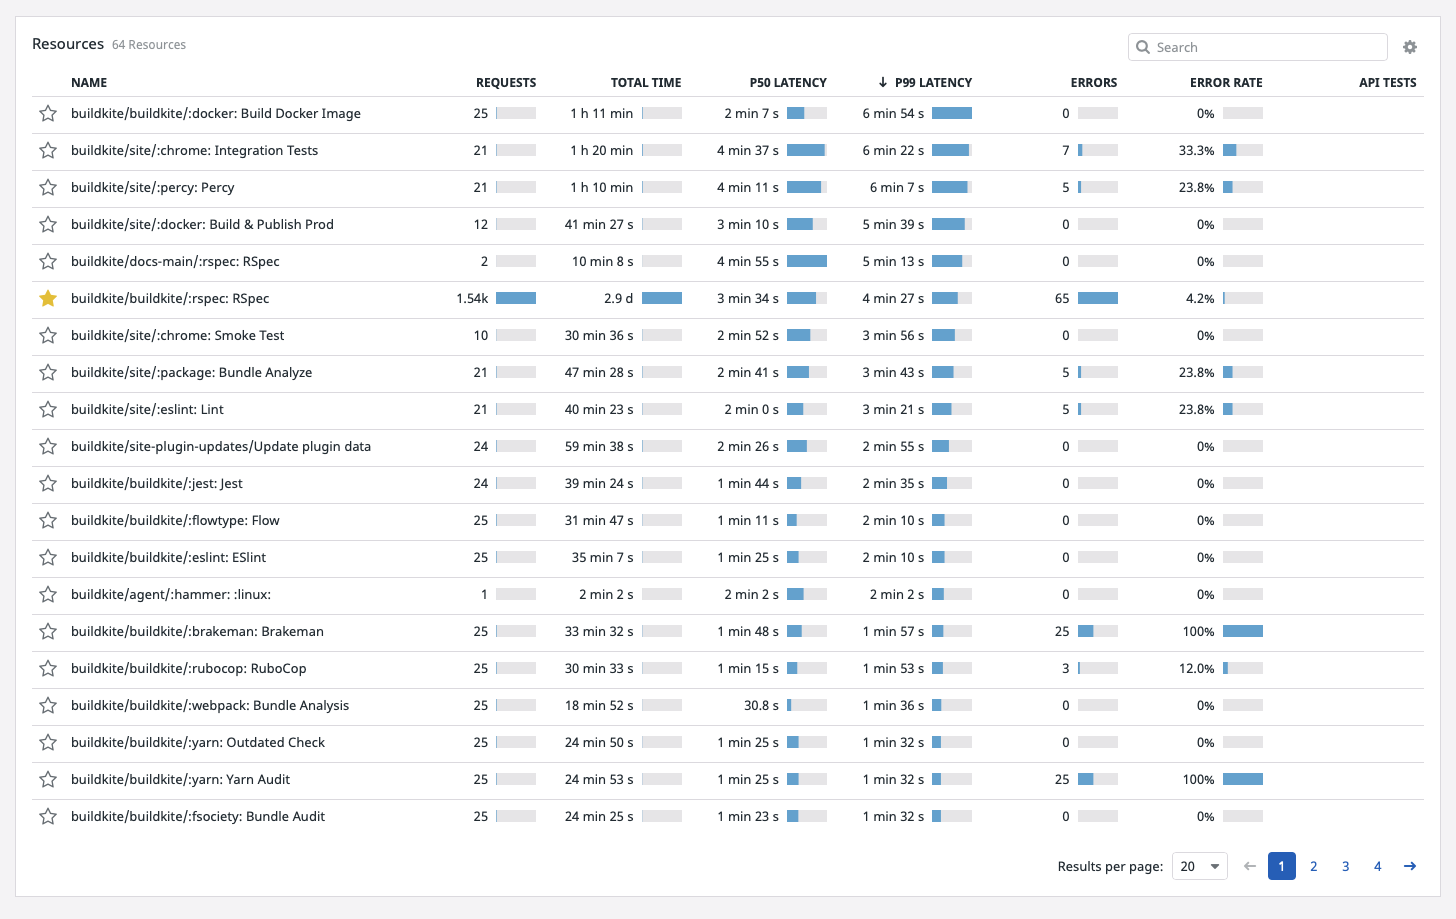
Further down on the same service page, we can see a resource for each of the common job steps we have on our CI infrastructure. Each resource takes the form: [organization slug]/[pipeline slug]/[step label]. This is where many users will find their first interesting insights. For example, we can see that our rspec tests are what we spend most of our compute time on, which makes sense as we break our test suite into 50 parallel steps for faster overall build times. Request count, latency distribution (P50 and P99), and error rate can all be useful information for helping to optimize your pipelines.
I think this pane is incredibly useful for someone looking to optimize their CI/CD compute resources. It helps us answer these questions:
- How many of these different step types do we have?
- How long have we spent doing them? And is that okay?
Traces
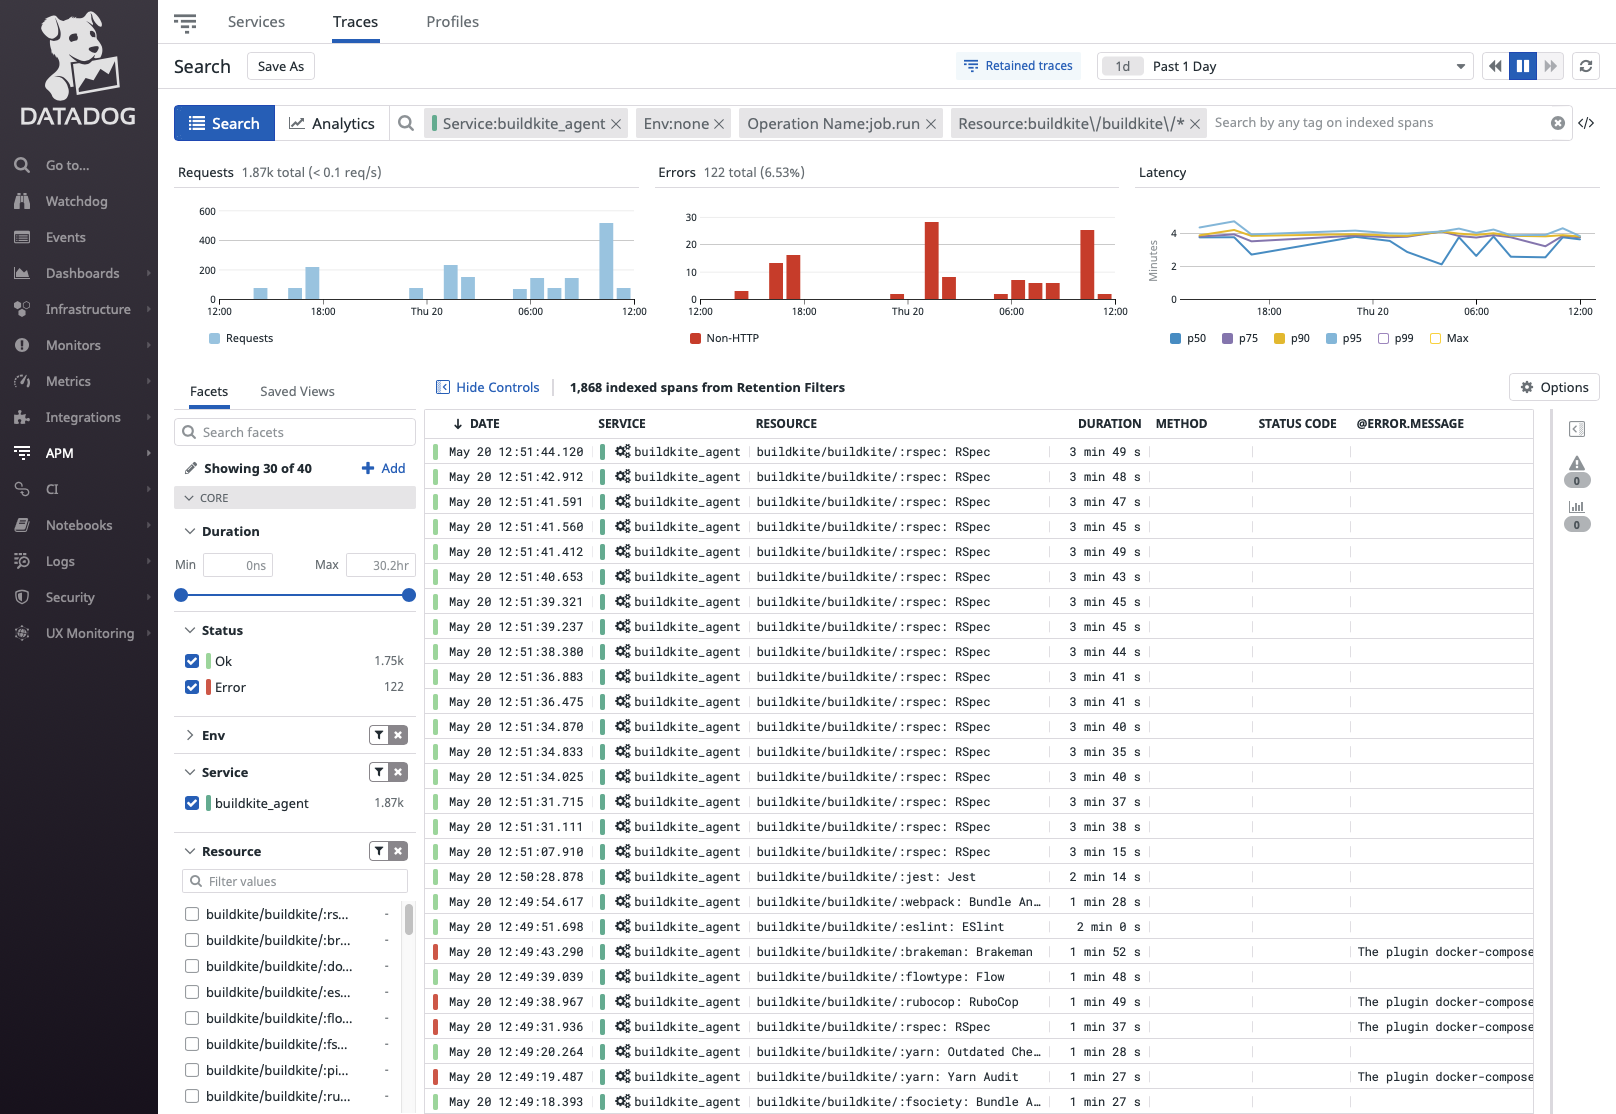
If we swap over to the “Traces” pane, we can see each of our retained job traces and perform queries. For example, here I used a Resource query to narrow it down to just traces from our “buildkite/buildkite” pipeline. Each of these traces can be drilled into to get more information about a given build it is associated with.
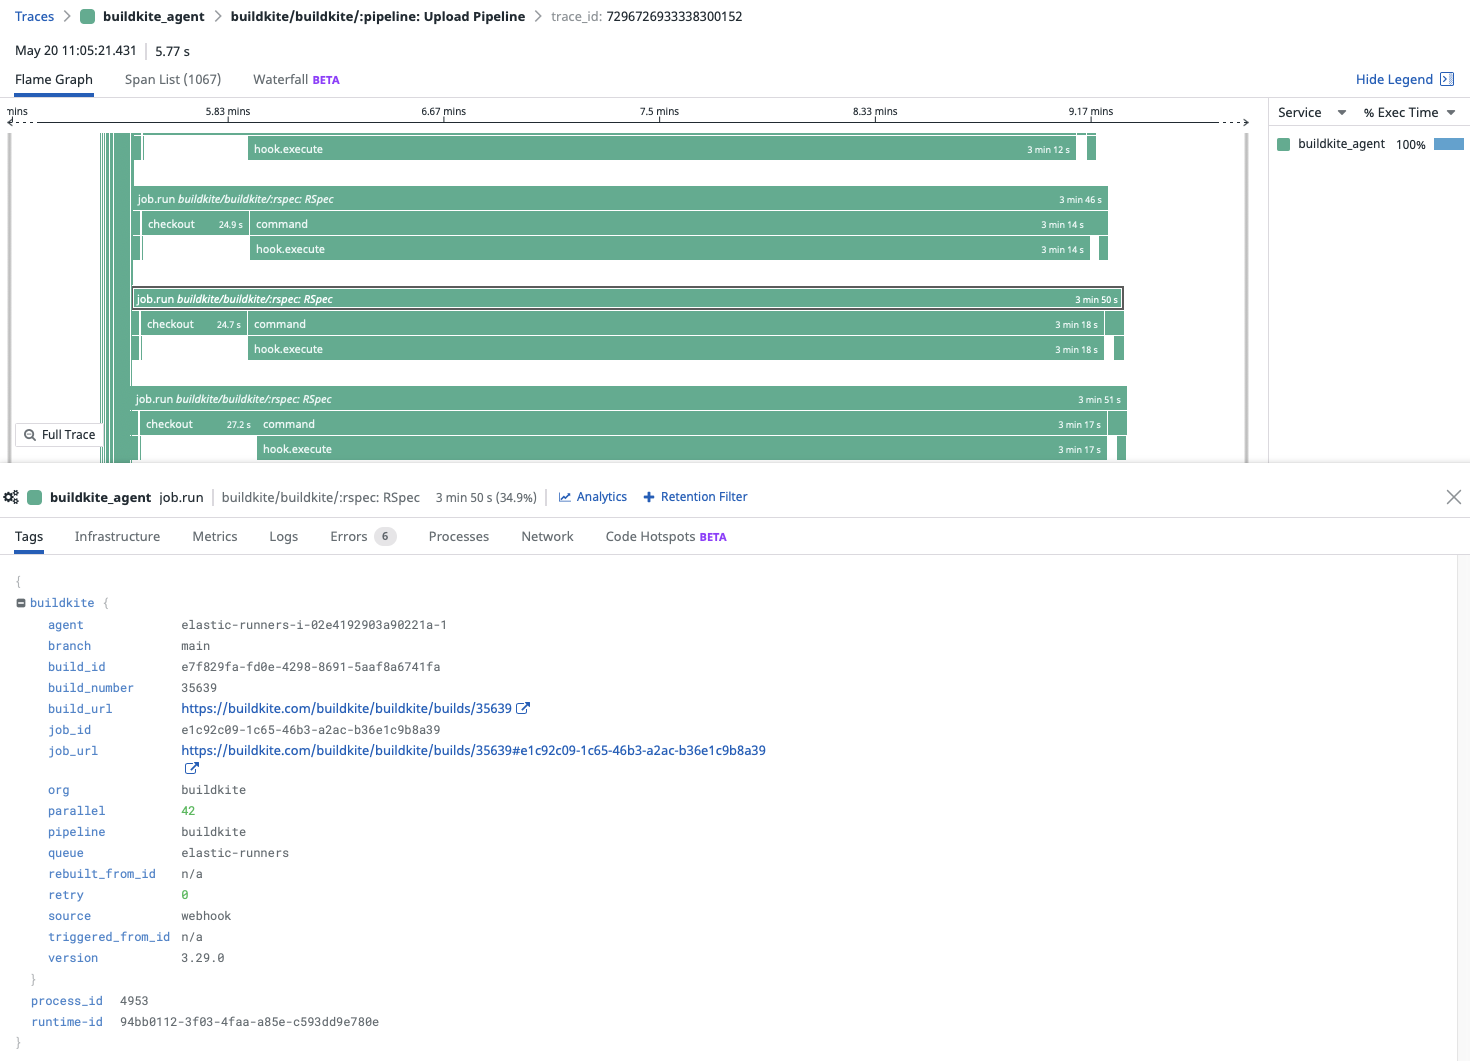
In this chart, we can see all of the different steps that an agent might execute. It really helps you diagnose all those really specific CI/CD issues, and surface them in a way that makes them much more discoverable. For example, we can see that checkout takes almost 25 seconds every single time. Maybe there's a way of making our checkout slightly more efficient.
You can also see all this information about the particular build itself--it’s pipeline, queue, and build number. It also has links to all the builds.
The usefulness of this particular chart will be really dependent on how many individual users are using Buildkite. If you've got a team of 100 developers or more, and they're running lots and lots of builds every day, they’ll probably find some interesting stuff in here. And it just gives you another lens to view at all.
What have we learned?
With the new Datadog tracing, we’ve discovered that we spend significantly more of our compute time on rspec testing and that the failure rate among those rspec tests was disproportionately high compared to other jobs for our monolith’s CI pipeline. This triggered efforts to reduce the overall flakiness of our test suite, which has saved our engineers time retrying tests and improved our overall CI infrastructure’s efficiency.
What’s next
Once again, a huge thanks to goodspark and samschlegel on GitHub for initially submitting this PR. We’re excited to be working with Datadog to continue improving monitoring integration with Buildkite. Next, our focus will turn to supporting other tracing backends that many of our customers use. Our plan to do this will involve migrating the existing APM implementation (built on OpenTracing) to OpenTelemetry now that it is more broadly supported, so stay tuned for updates. As always, we welcome contributions to the Buildkite Agent. It’s available open source on GitHub: https://github.com/buildkite/agent


